
If you’ve ever felt overwhelmed generating weekly or monthly project reports—pulling data from different sources, tracking down the latest versions, or battling spreadsheets—you’re not alone. Whether you’re a project manager, planner, scheduler, cost controller, or analyst, the real goal is clear:
📊 Spend less time compiling reports, and more time analyzing insights to improve project performance.
But traditional methods are holding you back because:
Imagine having a “One-Click Reporting Tool” for project controls—sounds impossible, right?
With Power BI, this is now a reality.
Power BI enables seamless automation for project controls reporting. You can transform your raw data into insightful, real-time dashboards in just seconds—without the pain of manual data crunching.
Did you know that with Power BI, you can:
Power BI is redefining how project professionals report, visualize, and analyze data. Isn’t it time you joined the revolution?

SPCM, Claims Expert, Reporting Pro.
Accompanied by Certification:
Certified Project Performance Analyst – Power BI (CPPA-BI®)
An online hands-on training workshop for project professionals
Advanced Power BI Data Analytics For Project Controls.

Forensic Delay Analysis and Associated Claims.

Project Cost and Budget Control.
Project Planning and Scheduling – End to End.
Delivered across 8 extensive live online sessions over 4 weeks, this course teaches you how to automate and streamline project controls reporting using Power BI from data modeling to dashboard design.
Each session features:
Upon completing this course, you’ll be able to:
📌 Automate your data workflows using Power BI Desktop.
📌 Build and share cloud-based dashboards with Power BI Service.
📌 Save 80% or more time on reporting through automated processes
📌 Design professional dashboards for cost, schedule, Risk, Quality and many other project functions
📌 Visualize key project metrics (EVM, Resource and Cost S-curves, Schedule Integrity, float erosion, trend analysis, etc.)
📌 Connect to Primavera P6 (EXCEL, XER, XML, SQL) and create dynamic dashboards
📌 Establish real-time dashboards with direct database connections
📌Use Power automate with Power BI to automate reporting, notifications, alarms and reminders to project team.
✅ Includes Certificate of Completion.
✅ Understand Power Reporting Mechanics and structure.
✅ Understand Power BI Interface and Key Tools & Tabs.
✅ Understand Power BI Connectivity Options.
✅ Understand Power Query Editor and “M” Language.
✅ Understand basics of Dax Language and Different Types of Measures.
✅ Create visuals and dashboard.
✅ Create Schedule layouts in P6 for easy and error free exports.
✅ Export Task and Resource Data from P6 to Spreadsheets.
✅ Prepare your data in Spreadsheets for loading Power BI.
✅ Connect Power BI with Excel to load schedule data.
✅ Use advanced Power Query Options to Transform Schedule Data.
✅ Apply different data transformations.
✅ Understand Intra-Tabular relationships and model your data.
✅ Review and Verify your data transformation & Modeling.
✅ Understand and Create Different Measures using Dax Functions.
✅ Understand and Create Quick Measures.
✅ Understand and Create Custom Columns.
✅ Create Schedule layouts for easy and errors free exports.
✅ Master the Art of Handling Measures.
✅ Understand Different Measures and Their uses.
✅ Understand and Create Filters and Slicers.
✅ Understand Time Phased Data in Power BI.
✅Understand and Create Date Table in Power BI.
✅ Create S Curves & Gantt Charts
✅ Pie Charges, Gauges, Timelines, Cards, and Bar Charts.
✅ Understand and Control relationships between visuals.
✅ Understand and Create Bookmarks and Page Navigations.
✅ Verify your visuals with Primavera Schedule.
✅ Publish you first Dashboard!
✅ Import P6 Data into Power BI Using XML Files
✅ Explore and Expand P6 XML Tables
✅ Understand Data Structure of XML Files
✅ Connect Power BI with XML file and perform advanced transformations.
✅ Create multiple tables from XML Files
✅ Create Dax Measures and Quick Measures
✅ Create Visuals and Dashboards.
✅ Understanding P6 SQLite Database
✅ Connecting Power BI with SQLite Database
✅ Access required information from SQLite Database
✅ Perform Data Transformation.
✅ Perform Data Modeling.
✅ Understand and Create Advances Dax Measures.
✅ Create Visuals and Dashboards.
✅ Introduction to Power Automate.
✅ Understanding the Application functions.
✅ Understanding Workflows and applications.
✅ Creating Workflows to automate the reporting process.
✅ Use Power Automate like a Pro and let the whole organization praise you.
✅ Prepare your cost estimate and budget database
✅ Apply Cost Account and Codes in your cost sheets
✅ Load your estimate, budget and cost sheets in Power BI
✅ Transform Date using Power Query Editor
✅ Create Dimension Tables
✅ Create Measure and Quick Measures (Dax) and use Custom Columns
✅ Model the available data
✅ Create Amazing Visuals for Risk Management Dashboard for estimates, budget, cost, gaps and pareto analysis.
✅ Publish Your Dashboard.
✅ Prepare and Validate Information.
✅ Load Datasets in Power BI.
✅ Transform Date using Power Query Editor.
✅ Create Dimension Tables.
✅ Model the available data.
✅ Create Measure and Quick Measures (Dax) and use Custom Columns.
✅ Create Amazing Visuals and Designs for Dashboard.
✅ Publish Your Dashboard.
✅ Receive Your Free Resources.
✅ Q/A Session.
✅ Goodbye Discussion.
This course is ideal for:
✔ Project Controls professionals seeking smarter reporting tools
✔ Planners/Schedulers looking to enhance communication with real-time visuals
✔ Cost Controllers aiming to save time and present insights with impact
✔ Estimators wanting to simplify and visualize evolving estimates
✔ Project/Program Managers needing quick performance insights
✔ Project leaders interested in data-driven decision-making
✔ Newcomers to Power BI ready to level up their reporting skills
✔ Self-taught users looking for structured, practical training
You do not need prior experience with Power BI. This course is designed to take you from beginner to advanced—even if you’re new to data analytics. A background in project controls is helpful, but not required.
💡 Note: Familiarity with Primavera P6 is recommended for certain case studies involving schedule data (XER, XML, SQL).
To follow the course effectively, you’ll need:
Enjoy anytime, anywhere access to your course — whether it’s early morning or late at night. You’ll have complete access to all recorded sessions for a full year from your registration date.
Earn an official certificate upon finishing the training. This includes PDUs (Professional Development Units) verified by expert instructors — perfect for professional growth
Get downloadable resources and extras, such as templates, visual aids, checklists, and handouts to support your learning journey.
Gain hands-on experience through practical case studies that help you understand how to apply concepts in real projects.
Access your course through a private and secure learning platform with your unique login credentials.
Learn on the go with compatibility across desktop, laptop, tablet, and mobile devices. The platform is fully responsive for flexible learning.
Get expert support through exclusive Q&A forums or live Q&A sessions with your instructor. Your questions are answered directly by industry professionals.
Unlock discounts for future courses at the same training academy. Stay connected and save on continued education with alumni-only pricing.
Start automating your reports. Save time. Gain insights. Join hundreds of professionals already using Power BI to supercharge their project controls reporting. Enroll today and take control of your project data like never before.
The Market Value of the Training:
Over $1,500
Your Pay:
Only $200
For this training.
The return on investment (ROI) is truly invaluable.
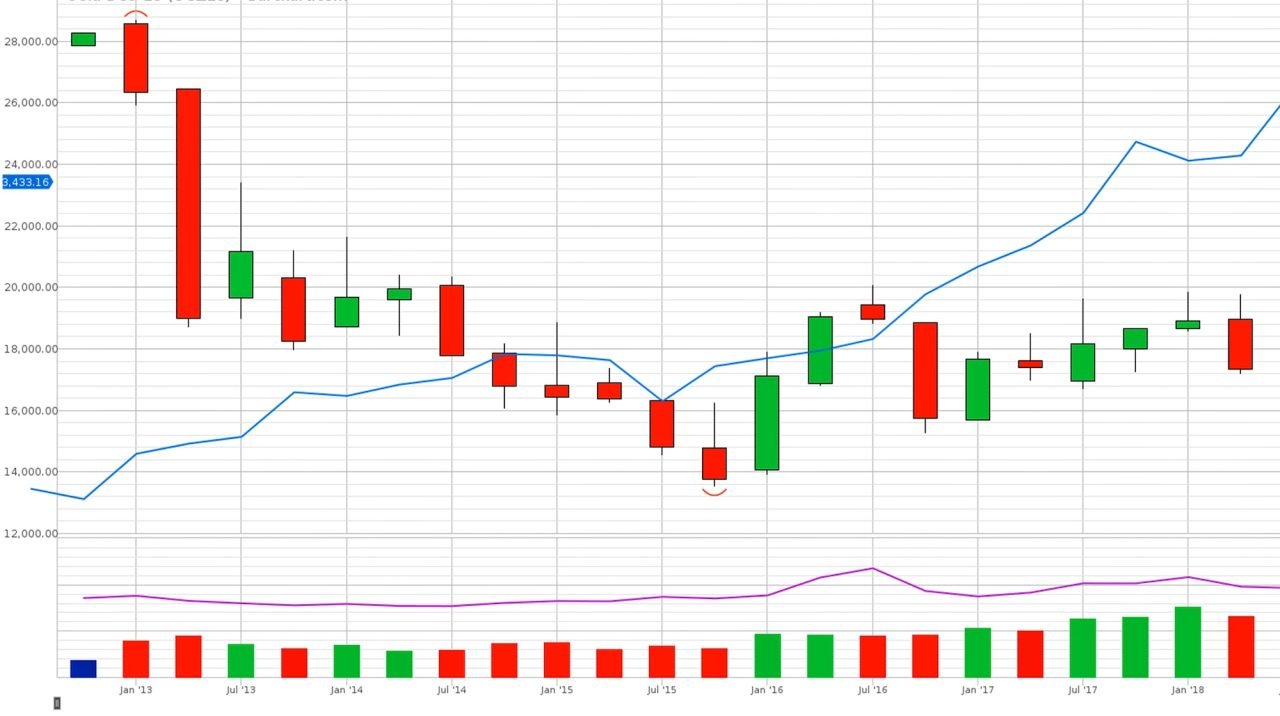
Stay ahead of the curve and impress your peers by creating automated project dashboards like the one shown below:
Hi. Welcome to PM Loop. How can we help you today?
🟢 Online | Privacy policy
Chat with us.